 >
>
Concept Graph & Resume using Claude 3 Opus | Chat GPT4 | Llama 3:
Resume:
1.-Martin Walkshofer, a software developer at g.tec, introduces the g.tec suite for handling biosignal amplifiers, real-time processing, and offline analysis.
2.-The g.tec suite includes various research tools that can be automatically updated, some requiring licenses and others freely available.
3.-Tools include a functional electrical simulator, recorder for medical use, montage creator, MATLAB tools for data conversion and offline analysis.
4.-APIs are available for C#, .NET, Python, MATLAB and visual stimuli tools. Licenses activate/deactivate access to certain professional features.
5.-Martin will demonstrate setting up an experiment, data acquisition, pre-processing, feature extraction, streaming data between applications, and offline analysis.
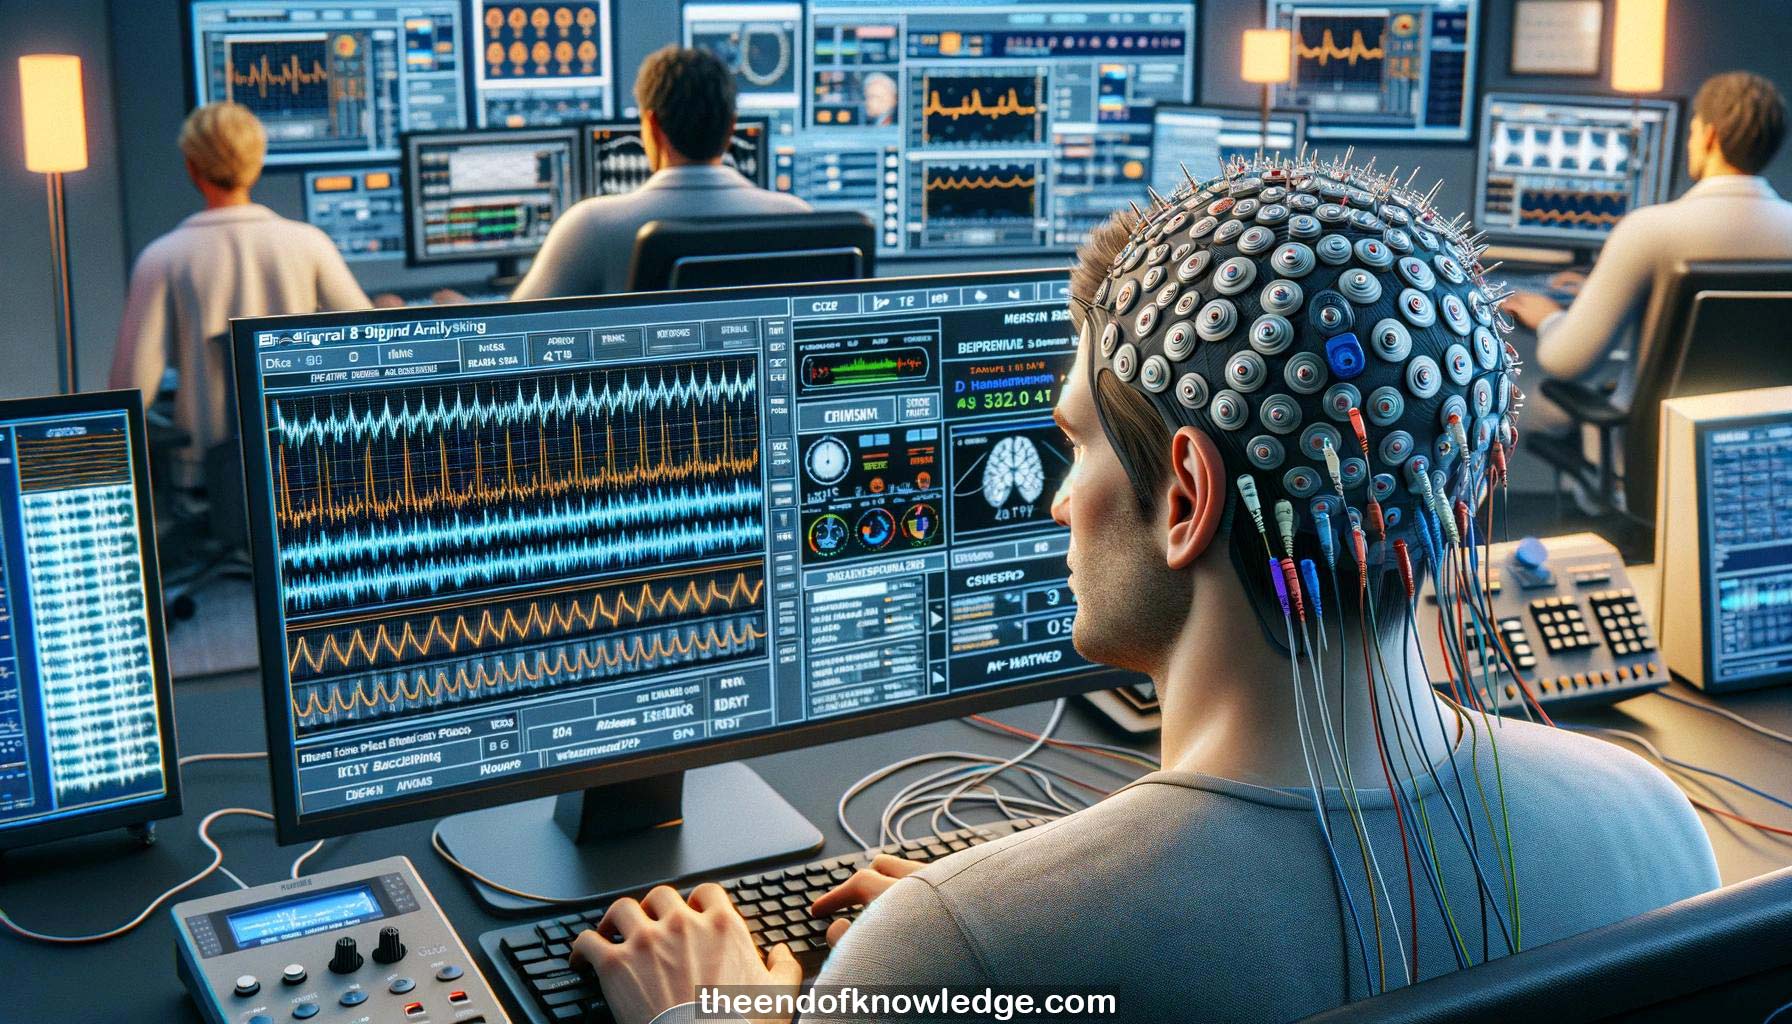
6.-Using a gel-based cap with dry pin electrodes on his colleague Michael, Martin starts a new Simulink model in MATLAB.
7.-He adds an amplifier block to acquire data from the connected cap and visualizes the raw EEG signal in a scope.
8.-Notch filters at 50Hz and 60Hz remove power line noise. A bandpass filter from 2-30Hz limits data to the EEG range.
9.-A second scope shows the filtered EEG data. Blinks, clenched teeth, and alpha waves with eyes closed are visible.
10.-Spectral analysis reveals an alpha peak around 10Hz. Setting up data acquisition and basic pre-processing took about 10 minutes.
11.-Martin splits out a single channel and calculates band power features for delta, theta, alpha and beta frequency ranges.
12.-A third scope plots the extracted band powers. Alpha power visibly increases when the subject closes their eyes.
13.-Raw data is logged to a file. The entire setup for acquisition, pre-processing, feature extraction and recording took about 15 minutes.
14.-A Lab Streaming Layer interface is added to stream the raw EEG data out to another application for further processing.
15.-A simple console application is shown receiving the EEG stream to demonstrate separating backend acquisition/processing from frontend GUI.
16.-Next, Martin demonstrates loading the saved EEG file into the gBS Analyze offline processing MATLAB toolbox.
17.-In gBS Analyze, he removes the timestamp channel, designs and applies a 2-30Hz Butterworth bandpass filter to clean the data.
18.-The first 10 seconds containing filter artifacts are cut out. Amplitude is scaled to ±100 μV for good EEG visibility.
19.-A 50Hz notch filter further cleans noise on one channel. Signal quality metrics flag a couple potentially bad channels.
20.-In a clinical setting, the compiled gRecorder application allows easy data visualization, filtering and recording without any programming.
21.-Connecting to the amplifier in gRecorder, raw unfiltered EEG is very noisy. Applying a 50Hz notch and 2-30Hz bandpass cleans it.
22.-Eye blinks, muscle artifacts, and alpha waves are visible in the filtered clinical-grade EEG. Data can then be saved to disk.
23.-While recording in gRecorder, a parallel research experiment is set up in gHIsys using its remote data acquisition block.
24.-The gHIsys model applies filters and visualizes both the raw gRecorder data and additionally filtered research-grade EEG.
25.-Eye blinks, EMG, and alpha are visible in both streams, with cleaner research-grade data. This parallel setup took just minutes.
26.-gHIsys models cannot directly export to embedded systems, but can stream out data to combine with e.g. VR in other applications.
27.-Up to 2 g.tec devices may stream on one PC before Bluetooth limits are hit. Multiple PCs can merge more streams.
28.-Capacitive EEG still faces challenges with electrode size, interference, and shielding compared to gel-based electrodes in close skin contact.
29.-While no open SDK exists for custom hardware in gRecorder, its data can stream out to other applications via API.
30.-g.tec actively participates in around 15 international research projects at any given time with about 100 total partners.
Knowledge Vault built byDavid Vivancos 2024