 >
>
Concept Graph & Resume using Claude 3 Opus | Chat GPT4 | Gemini Adv | Llama 3:
Resume:
1.-Equity means meeting people where they are and providing solutions based on their different individual needs, not just equality.
2.-Two key projects: AIM AHEAD to increase diversity in AI for health, and Racial Data Tracker to highlight structural racism.
3.-Racial Data Tracker collects and disseminates data on racial disparities across topics to inform advocacy and policymaking. Launches this month.
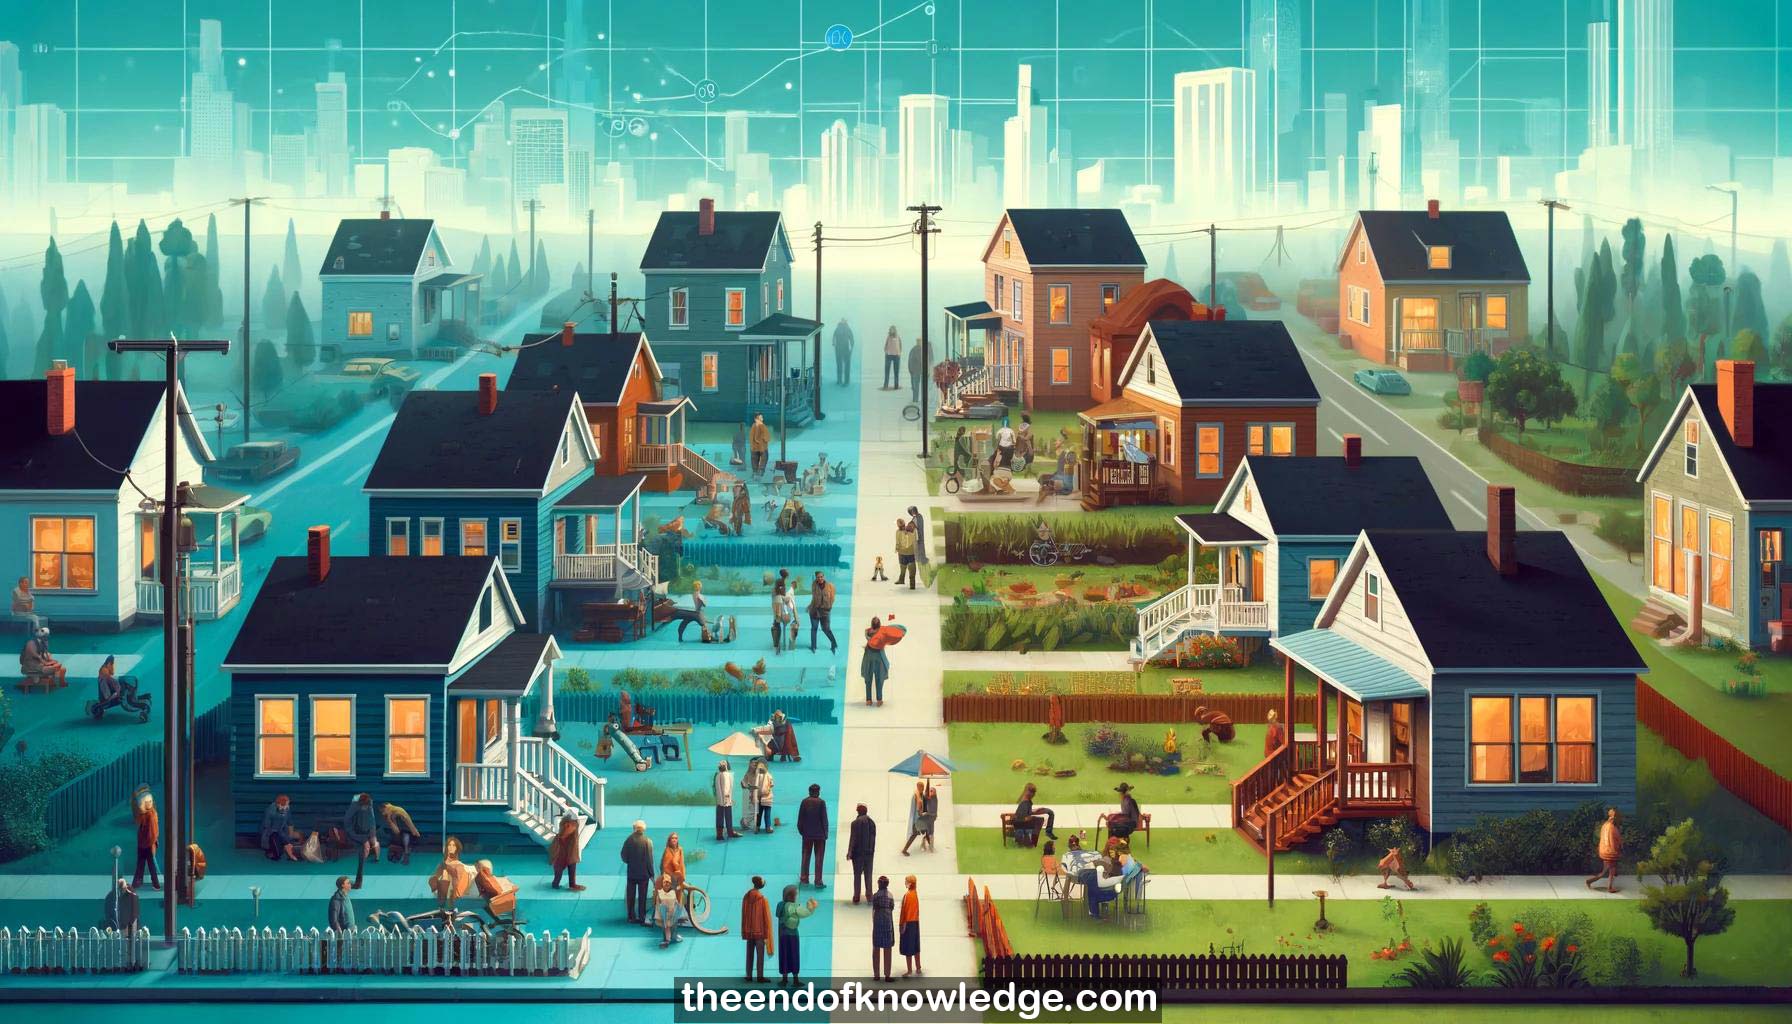
4.-A person's neighborhood is a major determinant of their life expectancy. Wealth and race/ethnicity also intersect with neighborhood.
5.-Social determinants of health (conditions of birth, living, work) impact health more than clinical care. Includes socioeconomic and environmental factors.
6.-Life expectancy varies significantly by race in the US. Males have lower life expectancy than females across racial groups.
7.-Historically racist policies like 1930s redlining of neighborhoods continue to impact health disparities and segregation in those areas today.
8.-Machine learning analysis of satellite imagery can accurately estimate neighborhood-level obesity rates, outperforming other data like points of interest.
9.-New analysis looked at 164M street view images to quantify racial disparities in built environment and impact on health.
10.-Classified neighborhoods by racial majority and matched to 1930s redlining maps. Data covered 59K neighborhoods in many US cities.
11.-Focused analysis on built environment features known or potentially related to health like green space, housing, sidewalks, crosswalks, etc.
12.-Found strong lingering association between 1930s neighborhood classifications and modern racial composition, suggesting lasting impact of discriminatory policies.
13.-Most significant finding was poor quality/multi-family housing strongly mediated disparities in sleep and asthma. Housing is critical for health.
14.-Goal is to measure and highlight inequities so they can inform policy changes. Without measurement, disparities are ignored.
15.-Wealth and economic factors do intersect with housing and health, but discriminatory policies have also independently shaped neighborhood environments.
16.-Team is considering how to analyze potential future impacts of current policies, such as those implemented during COVID-19 pandemic response.
17.-Change over time is evident in some areas getting worse, others better depending on targeted interventions. Racial Data Tracker will show trends.
18.-Bias in data used to understand these issues is a real concern that has to be carefully considered and mitigated.
19.-Complex intersectional factors require targeted, community-engaged interventions, not one-size-fits-all policies. But some social determinants of health are consistent globally.
20.-Research itself can influence behavior and outcomes, so potential societal impacts need to be considered in study design and data sharing.
21.-Quantifying and visualizing disparities, even if already generally known, is important for motivating policymakers to make changes over time.
22.-Collaborated directly with public health practitioners on past projects to influence disease surveillance. Racial Data Tracker builds on COVID tracking.
23.-Beyond proving disparities exist, research should provide guidance on potential policy solutions in accessible ways to enable advocacy.
24.-Changing built environment, like adding green space, is an example of a policy solution the research could point to.
25.-Need to study other countries in their specific policy contexts; impacts likely vary and results shouldn't be overgeneralized.
26.-Examining policies with positive vs negative disparity outcomes could suggest how to design better corrective policies for the future.
27.-The 1930s redlining classifications were highly problematic and discriminatory; we should not return to such labels today.
28.-Less segregated neighborhoods tend to have better socioeconomic and health outcomes overall. Reversing impacts of racist policies is needed.
29.-Racial disparities in home ownership, loans, and appraisals persist today in cities like Boston as a legacy of historical discrimination.
30.-BMI as a metric for obesity can be problematic across diverse populations; an acknowledged limitation in some of the analyses presented.
Knowledge Vault built byDavid Vivancos 2024